
FindYaTech Laptop Buyer Study
Laptop Buyer Study: What 5,042 Quiz Responses Show
The laptop quiz data shows four different buying stories, but they all converge on practical performance.
FindYaTech analyzed 5,042 aggregated laptop quiz responses collected from November 18, 2025 through July 20, 2026. Of those, 4,564 complete responses were used for five-point priority scoring. Students were the largest segment, while professionals, gamers, and content creators showed distinct budget and priority patterns. The results represent FindYaTech quiz users, not the entire laptop market.
Take the Laptop QuizAuthor and freshness
Written and reviewed by Andrew Costanzo, Founder, FindYaTech.
Published . Updated .
Bottom line
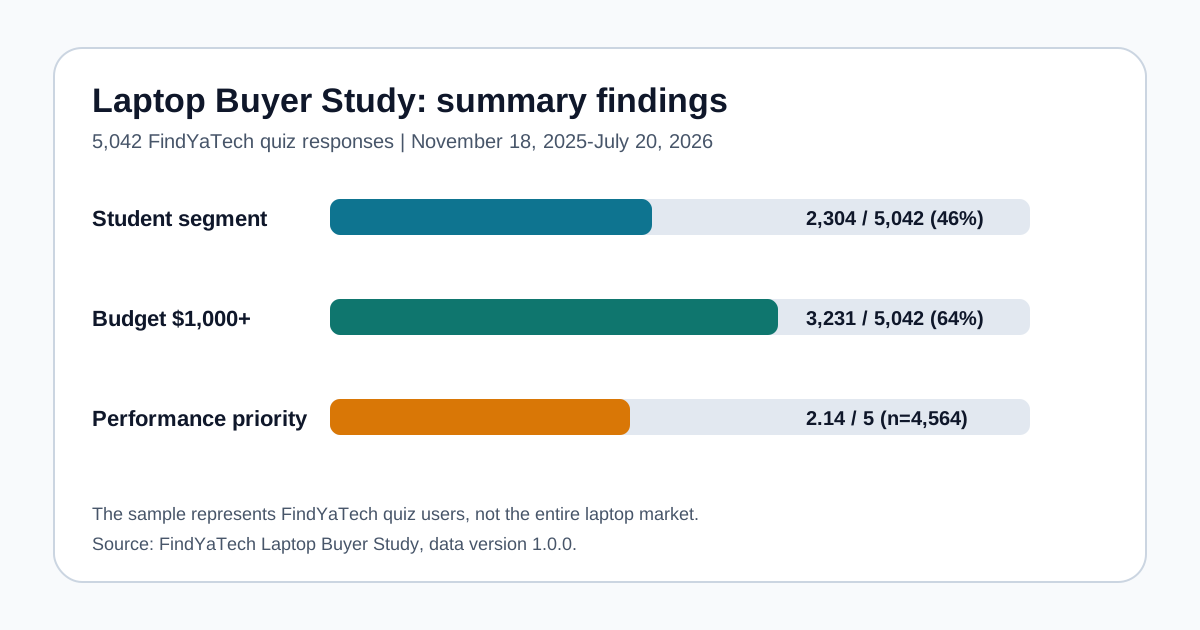
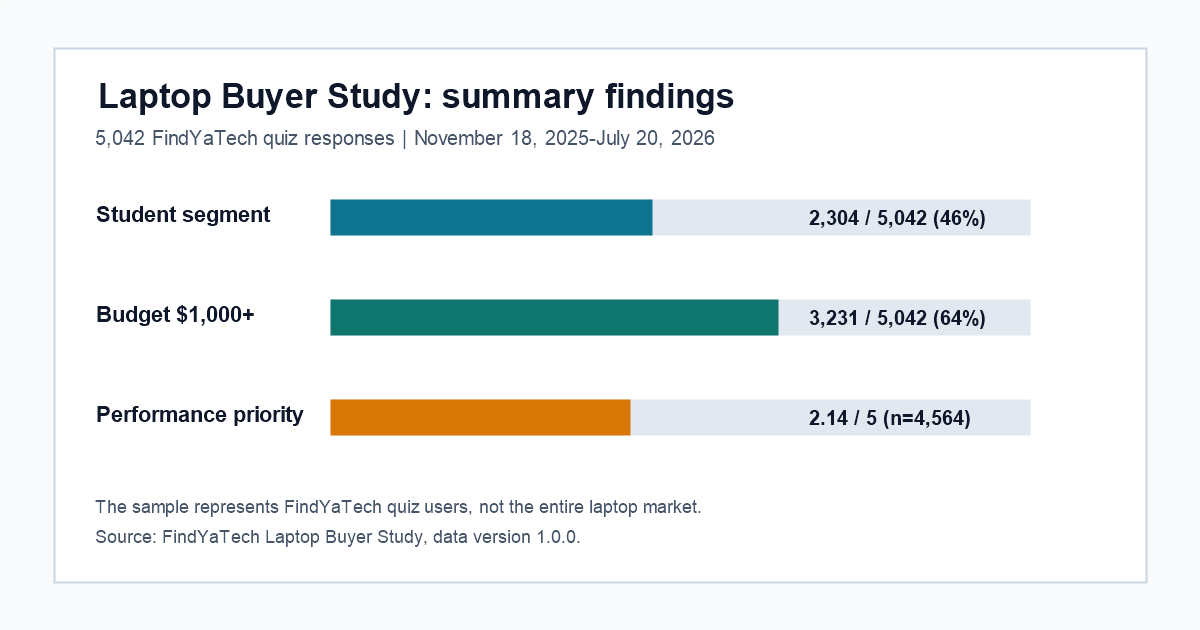
The laptop quiz data suggests shoppers are more performance-sensitive and segment-specific than a generic budget guide would imply: 64% budgeted $1,000+, students made up 46% of responses, and performance took 2.14 of 5 total priority points.
Study methodology
This study summarizes aggregated first-party FindYaTech laptop quiz data. It shows buyer-intent patterns among people who chose to use FindYaTech, not overall laptop market share.
- The study uses 5,042 laptop quiz responses collected from November 18, 2025 through July 20, 2026.
- Priority scoring uses 4,564 responses with a complete valid allocation across battery, longevity, and performance. The other 478 responses are excluded from priority averages only.
- Each complete priority response has exactly 5 total points, so averages should be read as shares of that five-point priority budget.
- Feature and brand questions allowed multiple selections. Their counts are selections rather than unique shoppers; optional or missing selections are not treated as negative preferences.
- Free-text responses are excluded from the downloadable files. Tiny long-tail or unclear segment answers remain in the overall n=5,042 count but are separated from major-segment comparisons.
- Because the sample is self-selected from FindYaTech quiz users, it should not be generalized to every laptop buyer.
Affiliate relationships may support FindYaTech, but they do not decide which findings are reported or how the data is summarized.
Download the aggregate dataset
These downloads contain anonymized aggregate counts only. They exclude personal data, free-text answers, user IDs, email addresses, and row-level quiz records.
Research documentation
Question wording and answer handling
The laptop quiz asked respondents to select the lifestyle closest to them, allocate five points across battery life, longevity, and performance, state their laptop knowledge level, select previously used brands, choose desired features, and provide a budget range.
- The original priority prompt was: “You’ve got 5 points to invest. Spend them across battery life, longevity, and performance.”
- Priority analysis excludes 478 of the 5,042 total responses because those records did not contain a complete valid five-point allocation, leaving n=4,564.
- Brand answers were optional. A missing brand answer is treated as no recorded brand signal, not as dislike of every brand.
- Desired features allowed multiple selections. Feature counts are selections, not unique people, and free-text answers are excluded from the public files.
Scope, bias, and interpretation
The results describe FindYaTech laptop quiz users during the collection period. They are buyer-intent signals, not a probability sample of the entire laptop market.
- People who choose to use a laptop-matching quiz may differ from laptop buyers who do not use FindYaTech.
- Percentages identify their response, segment, or selection denominator next to the finding.
- Counts can show association and demand signals, but they do not establish that one preference caused another.
Version, corrections, and reuse
Data version 1.0.0 was published July 29, 2026. Material corrections will increment the version and be recorded in the JSON changelog.
- Correction contact: [email protected].
- Aggregate data may be reused with attribution to “FindYaTech Laptop Buyer Study, version 1.0.0” and a link to this page.
- Reuse must not imply FindYaTech endorsement or describe the sample as representative of the entire laptop market.
Buyer segments: students were the largest group
The study starts by separating shoppers by intent: student, professional, gamer, content creator, and a tiny unclear group.
These are buyer-intent segments from 5,042 FindYaTech quiz responses, not a claim about the entire laptop market. Students were 2,304 responses (46% of n=5,042).
Sample: n=5,042 laptop quiz responses.
| Group | Measure | Value |
|---|---|---|
| Overall | Student | 2,304 responses / 46% |
| Overall | Professional | 1,508 responses / 30% |
| Overall | Gamer | 899 responses / 18% |
| Overall | Content creator | 316 responses / 6% |
| Overall | Other/unclear | 15 responses / <1% |
Budget distribution: $2,000+ was the largest bucket
The overall budget curve was not a lowest-price story. The largest single bucket was $2,000+.
3,231 of 5,042 budget responses (64%) landed at $1,000 or higher. That does not mean everyone should buy premium; it means this quiz audience included many shoppers trying to avoid underbuying.
Sample: n=5,042 responses with a recorded budget range.
| Group | Measure | Value |
|---|---|---|
| Overall | Under $500 | 328 / 7% |
| Overall | $500-$699 | 673 / 13% |
| Overall | $700-$999 | 810 / 16% |
| Overall | $1,000-$1,499 | 1,246 / 25% |
| Overall | $1,500-$1,999 | 537 / 11% |
| Overall | $2,000+ | 1,448 / 29% |
Budget mix by segment: premium intent was not limited to gamers
Each segment had a different premium ceiling, but every major group had meaningful $2,000+ demand.
These bars show share within each segment. Creators had the highest $2,000+ share at 33%, followed by professionals at 31%, gamers at 30%, and students at 26%.
Sample: n=5,027 responses in the four major buyer segments; 15 other or unclear responses are excluded.
| Group | Measure | Value |
|---|---|---|
| Student | Under $1k | 38% |
| Student | $1k-$1,999 | 36% |
| Student | $2k+ | 26% |
| Professional | Under $1k | 33% |
| Professional | $1k-$1,999 | 36% |
| Professional | $2k+ | 31% |
| Gamer | Under $1k | 36% |
| Gamer | $1k-$1,999 | 34% |
| Gamer | $2k+ | 30% |
| Creator | Under $1k | 38% |
| Creator | $1k-$1,999 | 30% |
| Creator | $2k+ | 33% |
Priority points by segment: performance took the biggest share
The quiz priority model gives each response 5 total points across battery, longevity, and performance.
Because the scores are out of 5 total points, 2.46 for gamers is high: it is almost half of every available priority point before battery life or longevity are counted. Overall, performance averaged 2.14/5, or 43% of the available weight.
Sample: n=4,564 responses with a complete valid five-point priority allocation.
| Group | Measure | Value |
|---|---|---|
| Student | Battery | 1.54 / 5 |
| Student | Longevity | 1.49 / 5 |
| Student | Performance | 1.97 / 5 |
| Professional | Battery | 1.27 / 5 |
| Professional | Longevity | 1.51 / 5 |
| Professional | Performance | 2.22 / 5 |
| Gamer | Battery | 1.04 / 5 |
| Gamer | Longevity | 1.50 / 5 |
| Gamer | Performance | 2.46 / 5 |
| Creator | Battery | 1.31 / 5 |
| Creator | Longevity | 1.59 / 5 |
| Creator | Performance | 2.10 / 5 |
Top feature requests: practical specs led
The most common feature requests were not gimmicks. They were the everyday specs that make a laptop feel usable longer.
These are raw feature-selection counts from 5,042 respondents. Multiple selections were allowed, so the counts are not unique shoppers and are not expressed as percentages.
Sample: feature selections from n=5,042 respondents; multiple selections were allowed.
| Group | Measure | Value |
|---|---|---|
| Overall | 16GB+ memory | 2,220 selections |
| Overall | Fast CPU | 2,203 selections |
| Overall | 512GB+ SSD | 1,824 selections |
| Overall | Quality display | 1,602 selections |
| Overall | 8h+ battery | 1,591 selections |
| Overall | Smooth web/email | 1,473 selections |
| Overall | All-day battery | 1,126 selections |
| Overall | Fast start-up | 934 selections |
Feature signals by segment: the same specs mattered in different amounts
Across the major segments, memory, CPU, storage, display, and battery kept reappearing near the top.
These are raw selection counts, so larger segments naturally have larger bars. The point is the pattern: students put battery near the top, while gamers and creators leaned harder into CPU, memory, storage, and display.
Sample: feature selections from n=5,027 respondents in the four major buyer segments; multiple selections were allowed.
| Group | Measure | Value |
|---|---|---|
| Student | Memory | 954 |
| Student | CPU | 905 |
| Student | SSD | 751 |
| Student | Display | 687 |
| Student | Battery | 823 |
| Professional | Memory | 676 |
| Professional | CPU | 706 |
| Professional | SSD | 568 |
| Professional | Display | 481 |
| Professional | Battery | 477 |
| Gamer | Memory | 451 |
| Gamer | CPU | 459 |
| Gamer | SSD | 388 |
| Gamer | Display | 332 |
| Gamer | Battery | 217 |
| Creator | Memory | 135 |
| Creator | CPU | 129 |
| Creator | SSD | 111 |
| Creator | Display | 100 |
| Creator | Battery | 72 |
Operating system preference: most shoppers were flexible
Operating system preference was usually left open, which suggests many buyers were shopping by need first.
Among the major segments, no preference/unknown dominated. Windows 11 was the largest stated OS preference, while macOS and Linux were smaller explicit signals.
Sample size is stated in the chart context.
| Group | Measure | Value |
|---|---|---|
| Overall | No preference/unknown | 3,475 major-segment responses |
| Overall | Windows 11 | 1,395 major-segment responses |
| Overall | macOS | 130 major-segment responses |
| Overall | Linux variants | 26 major-segment responses |
Brand signals by segment: HP, Dell, Lenovo, and Apple led
Brand signals are not the same as final purchases, but they show which names shoppers expected to see in their shortlist.
Brand counts can include broad awareness and availability effects. The useful takeaway is that HP and Dell were strong across every major segment, while Apple and Lenovo changed places depending on the segment.
Sample: brand selections from n=5,027 respondents in the four major buyer segments; multiple selections were allowed.
| Group | Measure | Value |
|---|---|---|
| Student | HP | 1,296 |
| Student | Dell | 1,004 |
| Student | Lenovo | 874 |
| Student | Apple | 905 |
| Professional | HP | 1,015 |
| Professional | Dell | 948 |
| Professional | Lenovo | 711 |
| Professional | Apple | 531 |
| Gamer | HP | 513 |
| Gamer | Dell | 407 |
| Gamer | Lenovo | 381 |
| Gamer | Apple | 240 |
| Creator | HP | 188 |
| Creator | Dell | 147 |
| Creator | Lenovo | 119 |
| Creator | Apple | 105 |
Student seasonality: back-to-school demand started before August
Student laptop responses increased sharply in spring and early summer, before the traditional back-to-school rush.
July data runs only through July 20, 2026, so it should not be read as a full-month total. The pattern still shows that student laptop research began months before classes.
Sample: n=2,304 student responses; July 2026 includes July 1–20 only.
| Group | Measure | Value |
|---|---|---|
| Overall | Dec 2025 | 5 responses |
| Overall | Jan 2026 | 13 responses |
| Overall | Feb 2026 | 84 responses |
| Overall | Mar 2026 | 226 responses |
| Overall | Apr 2026 | 437 responses |
| Overall | May 2026 | 497 responses |
| Overall | Jun 2026 | 530 responses |
| Overall | Jul 1-20 | 512 responses |
Priority score context
The priority model uses 5 total points per response. That makes performance at 2.14/5 a large signal, not a small decimal.
Sample: n=4,564 complete priority responses.
| Priority | Average points | Share of 5 points | Total points |
|---|---|---|---|
| Battery life | 1.36 / 5 | 27% | 6,189 |
| Longevity | 1.50 / 5 | 30% | 6,868 |
| Performance | 2.14 / 5 | 43% | 9,763 |
Operating system preference by segment
Most quiz takers did not force an operating system choice, but professionals showed the strongest Windows 11 preference.
Sample: n=5,026 major-segment responses with a coded operating-system value.
| Segment | No preference/unknown | Windows 11 | macOS | Linux variants |
|---|---|---|---|---|
| Student | 73% | 24% | 3% | <1% |
| Professional | 62% | 35% | 3% | <1% |
| Gamer | 73% | 26% | 1% | <1% |
| Content creator | 67% | 31% | 2% | <1% |
Top brand signals by segment
Brand signals show what shoppers expected to consider, not final purchases. HP and Dell were consistently strong across segments.
Sample: brand selections from n=5,027 major-segment respondents; multiple selections were allowed.
| Segment | No. 1 | No. 2 | No. 3 | No. 4 |
|---|---|---|---|---|
| Student | HP (1,296) | Dell (1,004) | Apple (905) | Lenovo (874) |
| Professional | HP (1,015) | Dell (948) | Lenovo (711) | Apple (531) |
| Gamer | HP (513) | Dell (407) | Lenovo (381) | ASUS (281) |
| Content creator | HP (188) | Dell (147) | Lenovo (119) | Apple (105) |
Primary findings from the FindYaTech quiz data
Budget reality
64% of budget responses were $1,000 or higher, and the $2,000+ group was the largest single bucket at 29%.
Priority reality
Performance averaged 2.14 across 4,564 complete priority responses. On a 5-point scale, that is about 43% of all available priority weight.
Segment reality
Students made up 46% of categorized responses, followed by professionals at 30%, gamers at 18%, and content creators at 6%.
Frequently asked questions
How many responses are in the laptop buyer study?
The study uses 5,042 aggregated laptop quiz responses collected from November 18, 2025 through July 20, 2026, plus 4,564 priority responses for battery life, longevity, and performance scoring.
Does this study represent the whole laptop market?
No. It represents FindYaTech quiz takers and should be read as first-party buyer-intent data, not total laptop market share.
Why does performance matter so much in the data?
Shoppers often feel speed, multitasking headroom, memory, and CPU quality every day. Performance averaged 2.14 out of 5 total priority points, which means it captured nearly 43% of the available priority weight.
Should everyone buy a $2,000 laptop?
No. The $2,000+ bucket being large does not mean every shopper needs that budget. It means FindYaTech should treat premium and performance-minded shoppers as a real part of the audience.
How does this study improve the laptop finder?
It gives the laptop finder a clearer evidence base: budget, buyer segment, performance priority, practical feature requests, OS preference, and brand signals all deserve to be considered before recommendations are made.